
MENU
それでは、実際にサーバーから送信されたSNMPトラップを見てみましょう。
このトラップが何を示し、次に何をすべきか、皆さんは何分で判断できるでしょうか。なお、機器のシリアル番号やIPアドレスなどはマスクしています。
CPQIDA-MIB::cpqDa7PhyDrvStatusChange (1.3.6.1.4.1.232.0.3046) - Physical Drive Status Change. This trap signifies that the agent has detected a change in the status of a drive array physical drive. The variable cpaDaPhyDrvStatus indicates the current physical drive status. User Action: If the physical drive status is failed(3) or predictiveFailure(4), replace the drive..
Varbinding Details:
[ System Up Time = 382 days, 2:34:41.64 ]
[ sysName.0 = demo-server. ]
[ sysName - sysName - An administratively-assigned name for this managed node. By convention, this is the nodes fully-qualified domain name. If the name is unknown, the value is the zero-length string. ]
[ cpqHoTrapFlags = 16 ]
[ cpqHoTrapFlags - Bit 2-4: Trap Condition: 0 = Not used (for backward compatibility),1: Condition unknown or N/A,2: Condition ok,3: Condition degraded,4: Condition failed,5-7: reserved.Bit 1:Client IP address type,0 = static entry,1 = DHCP entry.Bit 0:Agent Type,0 = Server,1 = Client ]
[ cpqDaCntlrHwLocation.0 = Slot 0 ]
[ cpqDaCntlrHwLocation - cpqDaCntlrHwLocation - A text description of the hardware location of the controller. A NULL string indicates that the hardware location could not be determined or is irrelevant. ]
[ cpqDaPhyDrvCntlrIndex.0.1 = 0 ]
[ cpqDaPhyDrvCntlrIndex - cpqDaPhyDrvCntlrIndex - Drive Array Physical Drive Controller Index. This index maps the physical drive back to the controller to which it is attached. The value of this index is the same as the one used under the controller group. ]
[ cpqDaPhyDrvIndex.0.1 = 1 ]
[ cpqDaPhyDrvIndex - cpqDaPhyDrvIndex - Drive Array Physical Drive Index. This index is used for selecting the physical drive table entry. This number, along with the cpqDaPhyDrvCntlrIndex uniquely identify a specific physical drive. ]
[ cpqDaPhyDrvLocationString.0.1 = Port=1I:Box=1:Bay=2 ]
[ cpqDaPhyDrvLocationString - cpqDaPhyDrvLocationString - Physical Drive Location String. This string describes the location of the drive in relation to the controller. If the location string cannot be determined, the agent will return a NULL string. ]
[ cpqDaPhyDrvType.0.1 = sas(4) ]
[ cpqDaPhyDrvType - cpqDaPhyDrvType - Physical Drive Type. The following values are defined: other(1) The agent is unable to determine the type for this drive. parallelScsi(2) The drive type is parallel SCSI. sata(3) The drive type is Serial ATA. sas(4) The drive type is Serial Attached SCSI. ]
[ cpqDaPhyDrvModel.0.1 = EG0900JETKB ]
[ cpqDaPhyDrvModel - cpqDaPhyDrvModel - Physical Drive Model. This is a text description of the physical drive. The text that appears depends upon who manufactured the drive and the drive type. If a drive fails, note the model to identify the type of drive necessary for replacement. If a model number is not present, you may not have properly initialized the drive array to which the physical drive is attached for monitoring. ]
[ cpqDaPhyDrvFWRev.0.1 = HPD8 ]
[ cpqDaPhyDrvFWRev - cpqDaPhyDrvFWRev - Physical Drive Firmware Revision. This shows the physical drive revision number. If the firmware revision is not present, you have not properly initialized the drive array. ]
[ cpqDaPhyDrvSerialNum.0.1 = XXXXXXXXXX]
[ cpqDaPhyDrvSerialNum - cpqDaPhyDrvSerialNum - Physical Drive Serial Number. This is the serial number assigned to the physical drive. This value is based upon the serial number as returned by the SCSI inquiry command but may have been modified due to space limitations. This can be used for identification purposes. ]
[ cpqDaPhyDrvFailureCode.0.1 = 20 ]
[ cpqDaPhyDrvFailureCode - cpqDaPhyDrvFailureCode - Drive Array Physical Drive Failure Code. This value is the drive failure reason code returned by the array firmware. It is valid only when the drive is failed. If the drive is not failed, 0 is returned. ]
[ cpqDaPhyDrvStatus.0.1 = failed(3) ]
[ cpqDaPhyDrvStatus - cpqDaPhyDrvStatus - Physical Drive Status. This shows the status of the physical drive. The following values are valid for the physical drive status: other (1) Indicates that the instrument agent does not recognize the drive. You may need to upgrade your instrument agent and/or driver software. ok (2) Indicates the drive is functioning properly. failed (3) Indicates that the drive is no longer operating and should be replaced. predictiveFailure(4) Indicates that the drive has a predictive failure error and should be replaced. ]
[ cpqDaPhyDrvBusNumber.0.1 = 0 ]
[ cpqDaPhyDrvBusNumber - cpqDaPhyDrvBusNumber - Physical Drive SCSI Bus Number. The bus number indicates to which SCSI bus this physical drive is attached. The first instance is one and increments for each SCSI bus on a controller. A value of -1 will be returned if the physical drive is attached to a controller that does not support multiple SCSI busses. This is not supported by the IDA, IDA Expansion, or IDA-2 controllers. ]
Trap Forwarded By: XXX.XXX.XXX.XXX
このトラップを確認したとき、まず「cpqDa7PhyDrvStatusChange」という記述から、サーバーの物理ドライブで何らかの状態変化が起きたことは推測できます。
続く説明には、「物理ドライブの状態が変化したこと」や、「故障または予兆障害の場合はドライブを交換すること」が記載されています。しかし、対象ドライブが実際に故障しているかどうかを判断するには、その下に続く詳細情報まで確認しなければなりません。
慣れている管理者であれば、トラップの内容を順番に読み解き、どのドライブに何が起きているのかまで判断できるでしょう。
一方、慣れていないオペレーターにとって、この英文の奔流から必要な情報をすぐに読み取るのは簡単ではありません。OIDを検索してトラップの意味を調べたり、サーバーの管理ツールにログインして状態を確認したりすることもあるでしょう。
人間がトラップを理解するには、それなりの時間と経験が必要です。また、担当者の知識や経験によって、初動対応にばらつきが生じる可能性もあります。
さらに、SNMPトラップには、今回のように故障を示すものもあれば、状態変化を通知するだけで、すぐには対応を必要としないものもあります。しかし、「対応不要」と判断するためにも、まずはトラップの内容を確認しなければなりません。こうした内容確認と対応要否の判断も、運用担当者の負担になっています。
このように複雑なトラップでも、AIを活用することで内容を効率的に読み解くことができます。
現場によっては、トラップの内容をCopilotやChatGPTなどの生成AIに入力し、その意味を調べているケースもあるのではないでしょうか。
今回は、HPEの統合IT運用管理プラットフォームであるOpsRampを使い、SNMPトラップをAIでどのように解析できるのかを見てみます。
OpsRampのAI機能であるOpsPilotを使うと、アラート画面から直接、アラートの解析を実行できます。
下の画面がOpsRampのアラート画面です。「Probable Root Cause(考えられる根本原因)」タブを開き、「Analyze possible root cause of alert with AI」を選択すると、AIによる解析が始まります。トラップ本文を別の画面へコピーする必要はありません。


今回の検証では、数十秒で解析が完了しました。
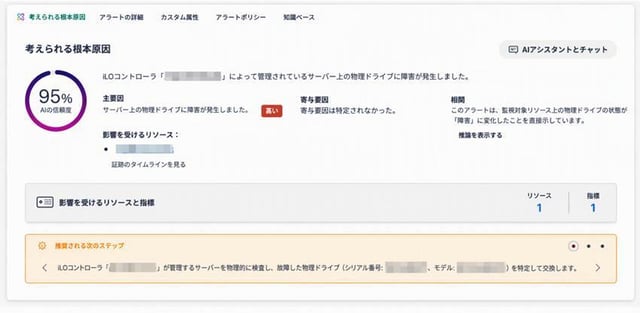
解析結果は以下のとおりです。
解析結果の信頼度:95%
考えられる根本原因:
iLOコントローラーによって管理されているサーバー上の物理ドライブに障害が発生
主要因:
サーバー上の物理ドライブに障害が発生
重要度:高
相関:監視対象リソース上の物理ドライブの状態が「障害」に変化したことを、アラートが直接示している
影響を受けるリソース:
対象iLO/サーバー:1リソース
推奨される次のステップ:
対象サーバーを確認し、故障した物理ドライブを特定します。そのうえで、シリアル番号とモデルを確認し、該当するドライブを交換します。
掲載している解析結果ではマスクしていますが、交換対象を特定するためのディスクのモデルやシリアル番号も提示されました。
SNMPは新しい技術ではありません。OIDやMIBを中心とした仕組みも、人間にとって分かりやすいインターフェースとは言いにくいでしょう。
とはいえ、SNMPをやめればよいという話でもありません。SNMPは、さまざまな機器から状態やイベントを取得する仕組みとして、現在のITインフラでも広く使われています。
変えられるのは、その先の運用です。
機器から届いた情報を一つひとつ読み解く。大量のアラートから対応すべきものを判断する。分からなければMIBを調べる。こうした一連の作業を、AIに手伝ってもらうことができます。
SNMPをやめるのではなく、SNMPを人間が頑張って読むのをやめる。
これも、AIOpsが実現する運用改善の一つではないでしょうか。
では、SNMPトラップではなく、CPUやメモリなどのパフォーマンス監視で発生したアラートではどうでしょうか。単に「閾値を超えた」と知らせるだけでなく、その背景までAIは読み解けるのでしょうか。次回、実際に試してみます。
HVM は、単⼀のインターフェイスからKVMベースとVMwareベース両⽅の仮想マシンをプロビジョニングや管理することが可能です。